
Using prometheus to monitor docker statistics
Prometheus is an open-source systems monitoring and alerting toolkit. It is a monitoring framework.
Grafana allows you to query, visualize, alert on and understand your metrics no matter where they are stored. It is a graphing solution i.e a frontend to prometheus.
Prometheus has many exporters, agents that export statistics from various apps and systems.
cadvisor exports container information.
node-exporter exports system information.
node-exporter not designed to be used in docker.
If you want to use it in docker specify volumes, use bind mounts.
Taken from vegasbrianc
  node-exporter:
    image: prom/node-exporter
    volumes:
      - /proc:/host/proc:ro
      - /sys:/host/sys:ro
      - /:/rootfs:ro
    command:
      - '--path.procfs=/host/proc'
      - '--path.sysfs=/host/sys'
      - --collector.filesystem.ignored-mount-points
      - "^/(sys|proc|dev|host|etc|rootfs/var/lib/docker/containers|rootfs/var/lib/docker/overlay2|rootfs/run/docker/netns|rootfs/var/lib/docker/aufs)($$|/)"
Edit docker-compose from vegasbrianc
Check for conflicting ports
Copy prometheus.yml
sudo docker-compose up -d
Check everything works
open browser:
- cadvisor http://your-host-ip:8084/containers/
- prometheus(all state is up) http://your-host-ip:9090/targets
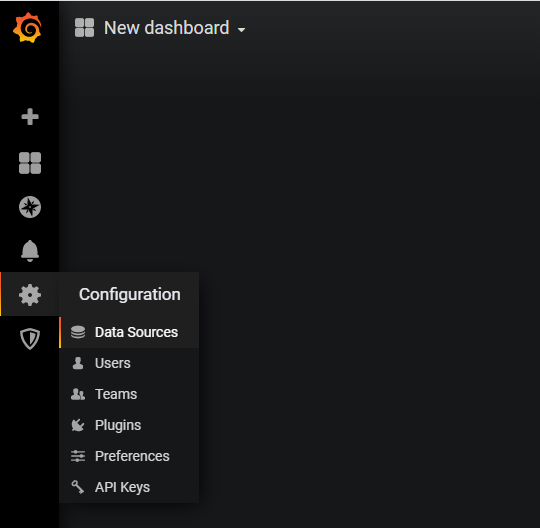
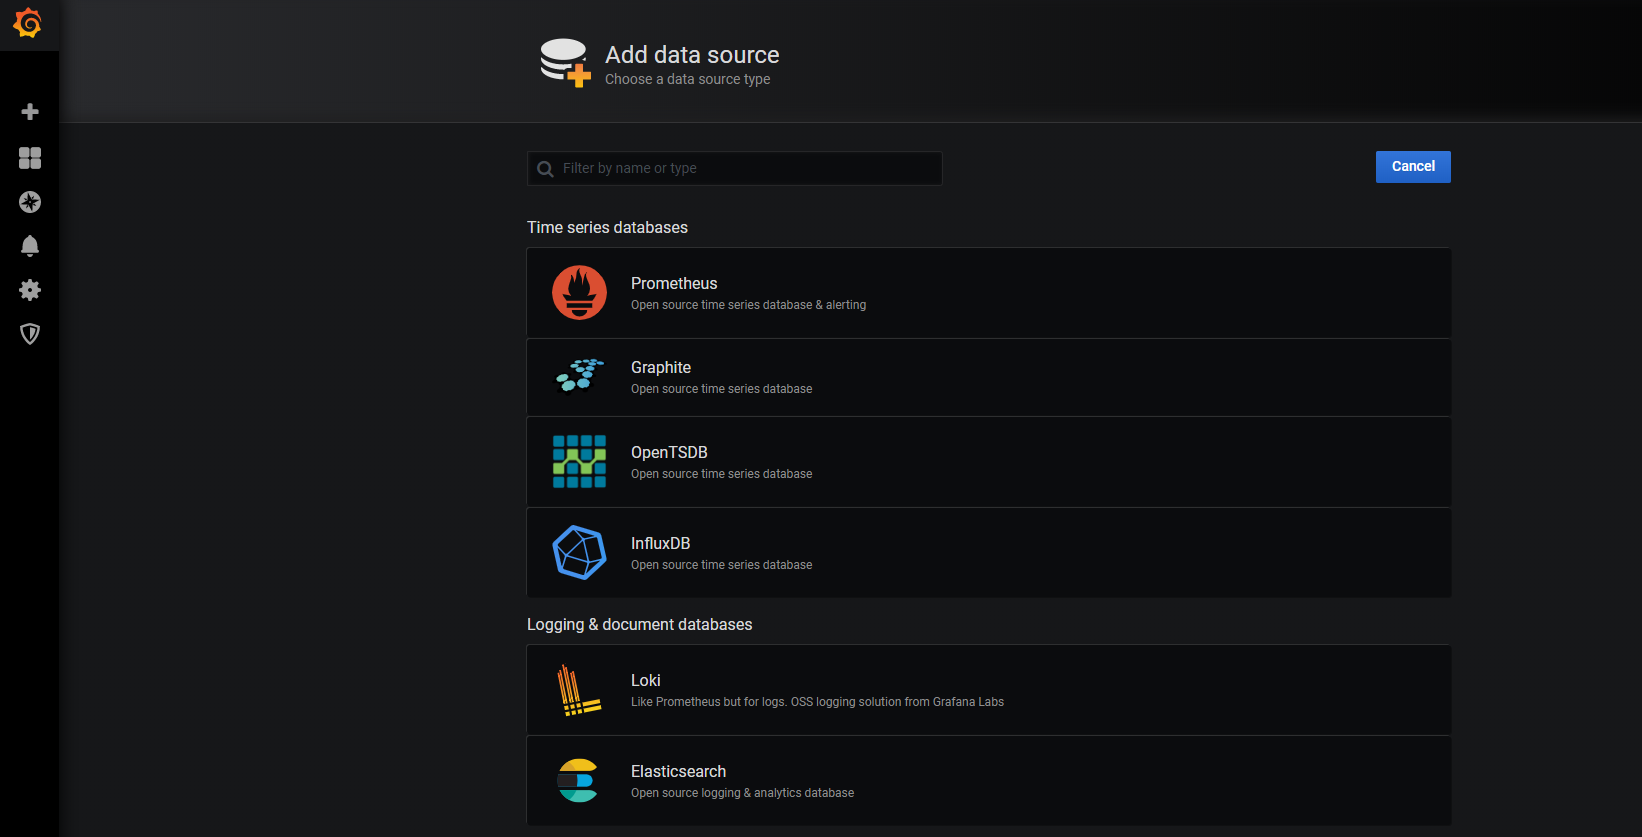
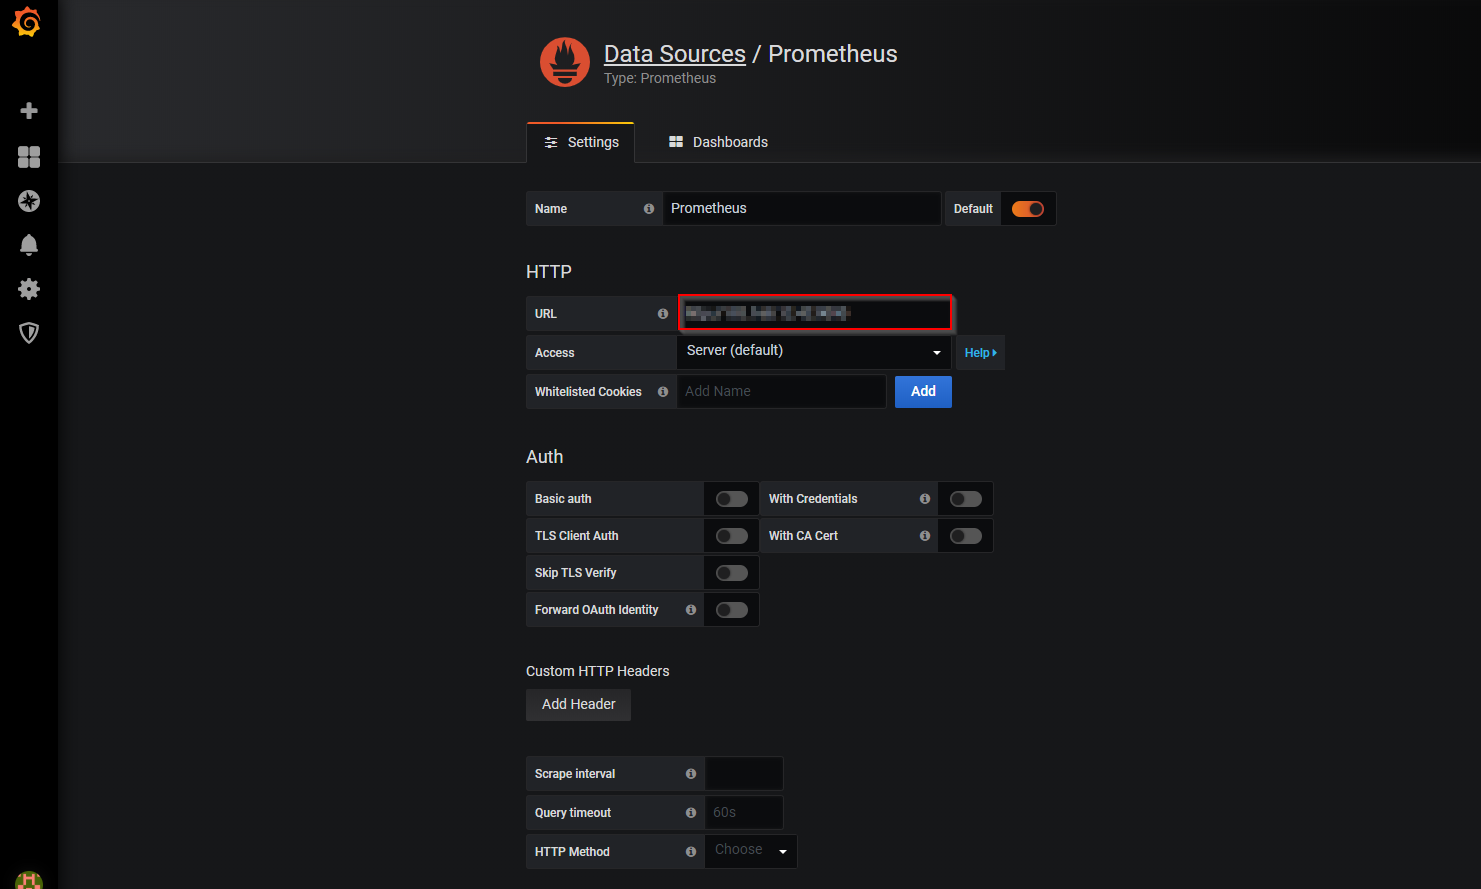
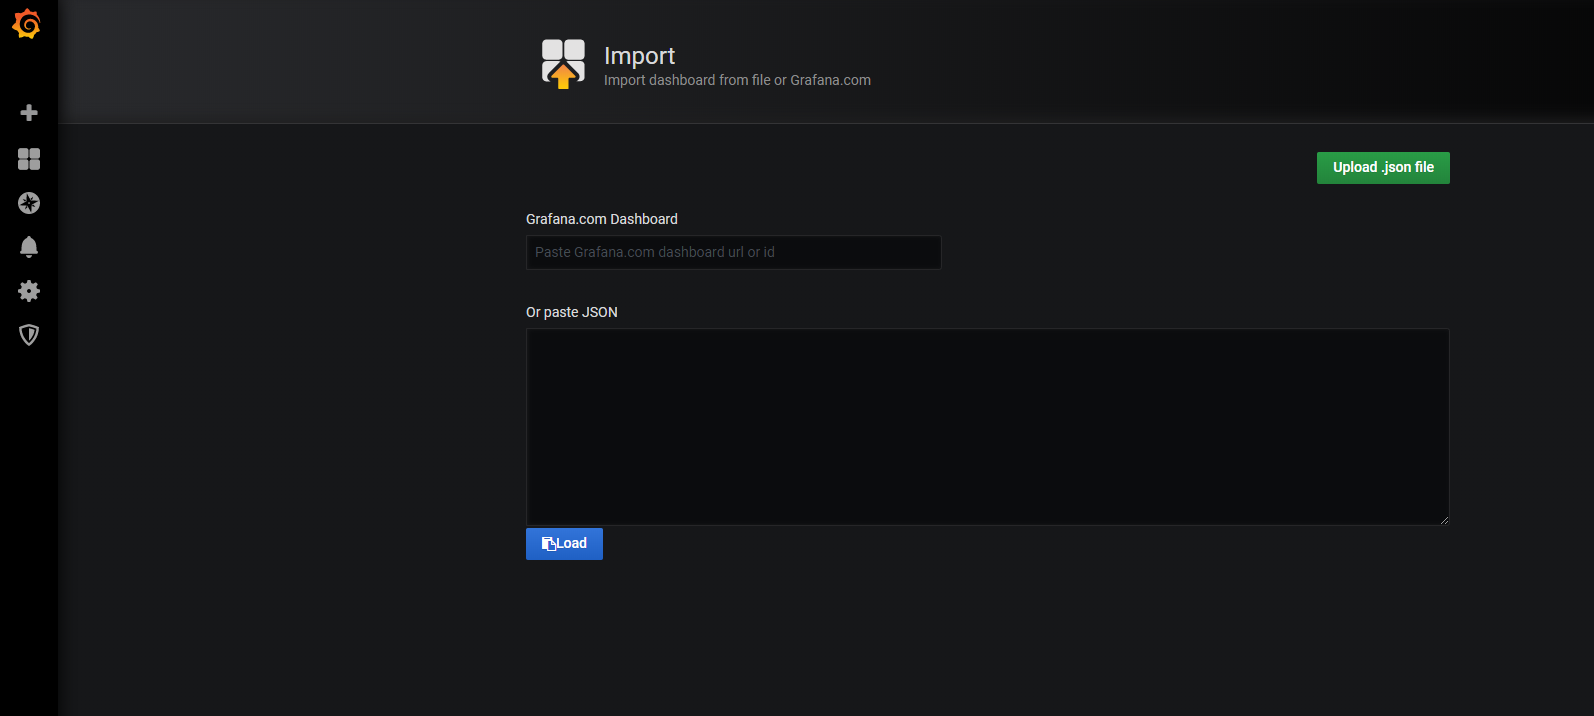
- grafana(add datasource, dashboard) http://your-host-ip:3000/
grafana login use passwd defined in docker-compose.yml, change it after login.
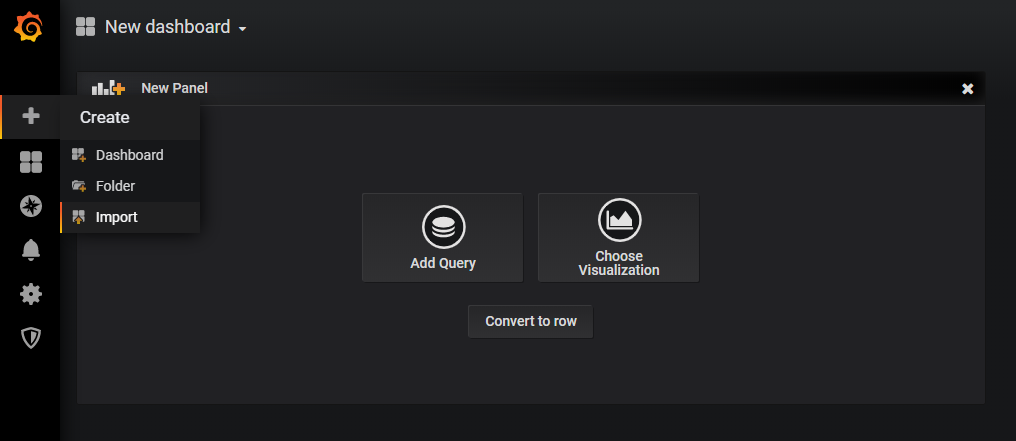
grafana setup steps
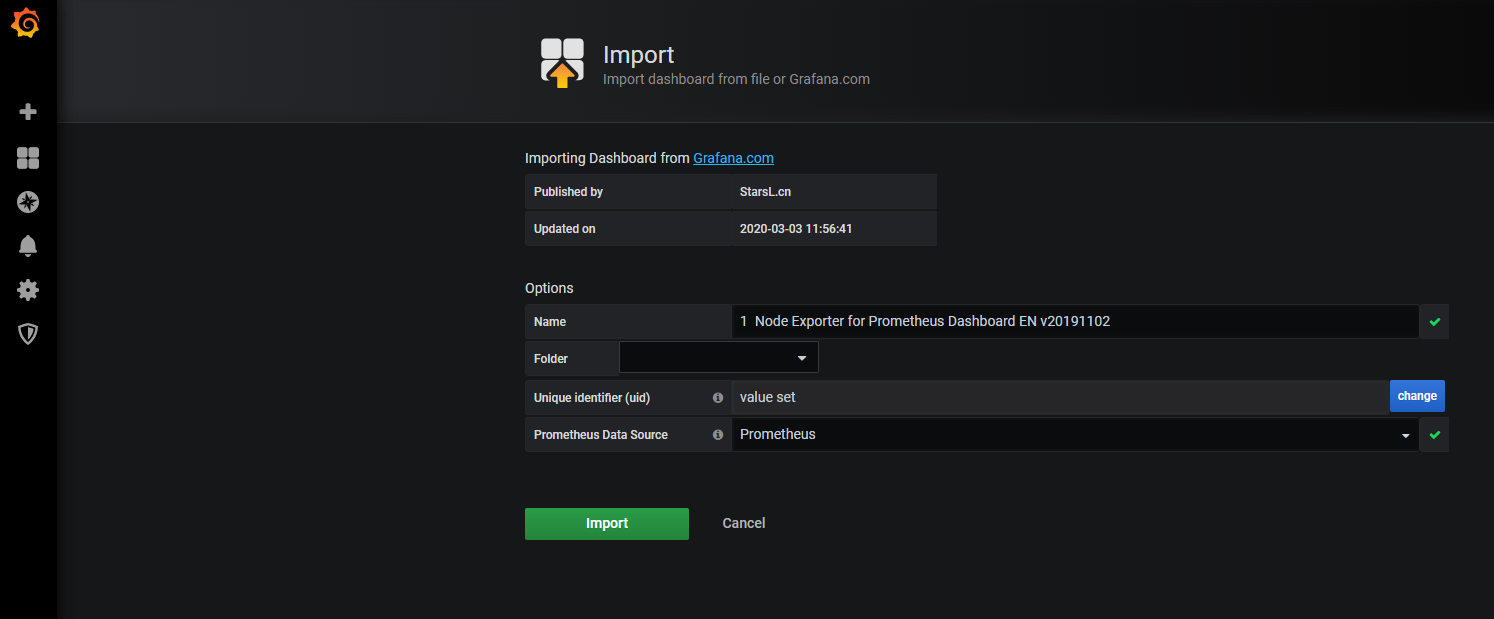
Using dashboard from 11074
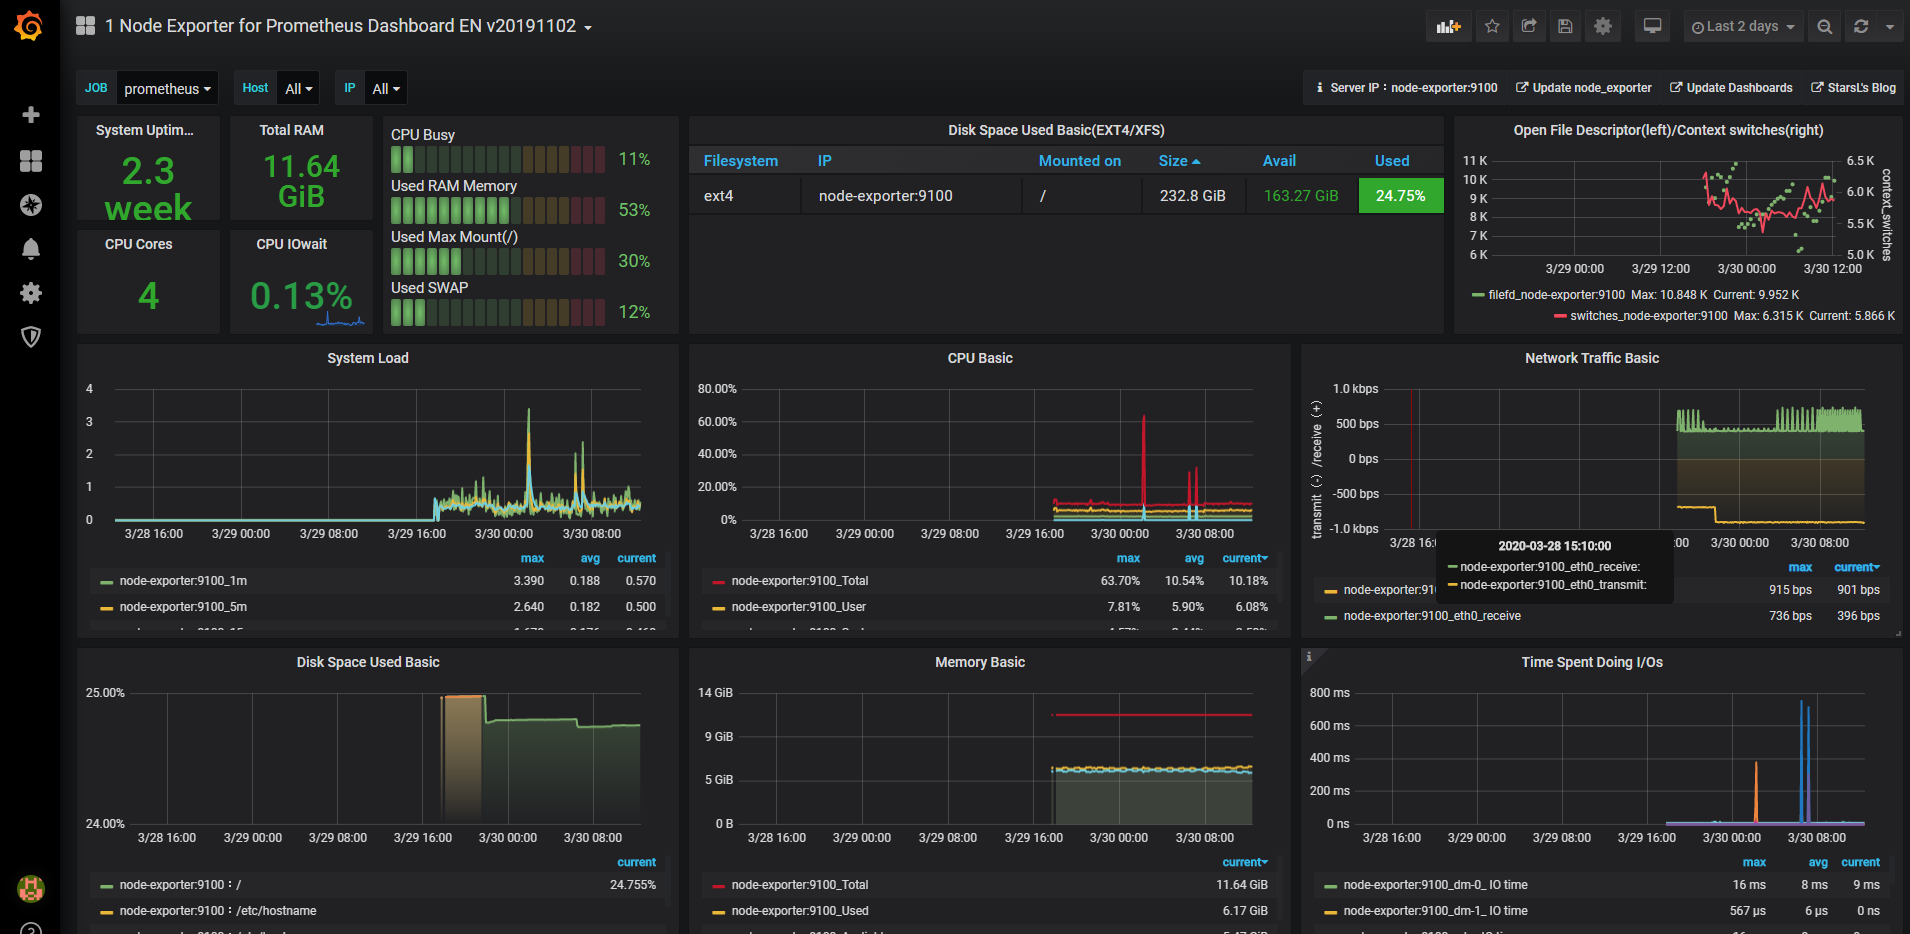
Final result
Comments